DNA sculptures
Tuesday, December 23rd, 2008Last friday I attended a talk, which was organized by the munich center for nanoscience. The talk was given by Tim Liedl from the Shih Laboratory.
randformblog on math, physics, art, and design |
Last friday I attended a talk, which was organized by the munich center for nanoscience. The talk was given by Tim Liedl from the Shih Laboratory.
A reader was asking in a preceding post:
Thank you for interesting explanation. So you say that high-rank officials who does not like to be critized should better take the pills you mentioned, since they probably have this sickness you describe?

Some images from the recent exhibition at the Fukuoka Asian Art Museum “Visualising the bright future – Propaganda Pictures of New China” which displayed political posters from China. The posters were contrasted with some artwork of more recent artists (like Feng Mengbo, Xu Zhiwei and Ai Weiwei) which supplemented the permanent collection featuring e.g. Lin Tianmiao (please see below).

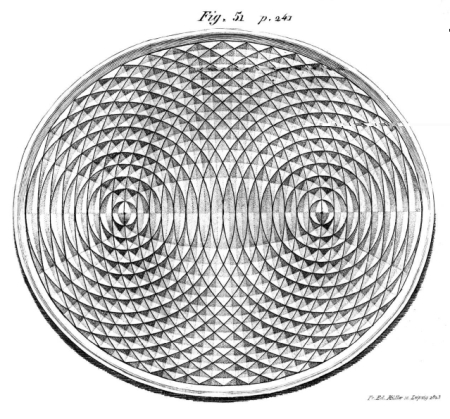
The above scientific visualization (which displays the wave pattern of a little droplet dropped into mercury in one focus of the ellipse) can be found in a book by Wilhelm Weber and his brothers Ernst Heinrich Weber. It can be found in principle on p.582 in the html version or on p. 619 of the pdf version at a google books scan of the book: “Wellenlehre auf Experimente gegründet, oder, über die Wellen tropfbarer Flüssigkeiten mit Anwendungen auf die Schall und Lichtwellen” (The theory of waves based on experiments or about waves of drippable liquids with applications to sound and lightwaves). The book is from 1825. Unfortunately the google scan has not such a nice quality as e.g. a scan of galileos works mentioned in this randform post. In particular in the google scan one can’t read that the drawing was made by:

Is Fr. Ed. Mueller the secret pioneer of Op Art?
The US National Institute of Standards and Technology has released a beta version of some chapters of a Digital Library of Special Functions. The final atlas is expected 2009 and shall be available in print as well. The figures showing graphs are in 3D as well and here good old VRML comes back again. If I had been asked I kwould have opted for either a more recent file formar or a simpler one.

The above image displays a visualization of the socalled blancmange curve at various iteration steps and with a slightly randomized sawtooth function. The blancmange curve -not to confuse with the blancmange pudding– is -like e.g. also the devils staircase a socalled pathological function, i.e. a function which displays a counterintuitive behaviour. In order to obtain the blancmangecurve one sums up little sawteet h which get smaller and smaller. However also if the sawteeth are getting in the end infinitely small this particular curve will never be smooth.
mathematical subleties after the more
In this post a class/seminar about collaborative e-learning was mentioned in which I took part in 2004. The seminar was called “Ikarus”. I just noticed that the seminar, which was made accessible online in an anonymized fashion was taken offline recently (somewhat justifying the naming ikarus ;)). Since I found no documentation about the seminar, I would like to use this post to document a bit what this seminar was about, because I think it was a truly innovative occasion.
The instantreality-framework is a high-performance Mixed-Reality (MR) system, which combines various components to provide a single and consistent interface for AR/VR developers. Those components have been developed at the Fraunhofer IGD and ZGDV in close cooperation with industrial partners.
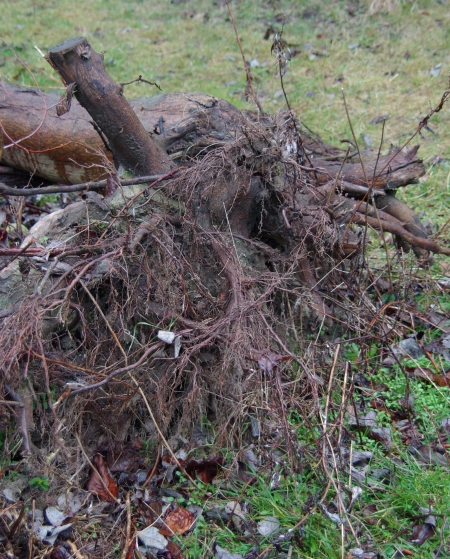
 “no nodes and ways in the paths of a root“, image by —|.
Dennis Lorson an Electrical Engineering/CS student at the Catholic University of Leuven, Belgium is currently looking for suggestions of how to enhance his program pathway, which is a graph vizualisation programm, which is displaying among others the various radii of information retrieval (screenshot demonstration).
From the website:
It accomplishes this by presenting you with a graphical “network” representation of your visited article pages. A node represents an article, a connection between two nodes means, of course, that you’ve gone from the first article to the second one. You can save the network you’ve created to disk and recover it.
This way, you’re able to keep track of everything: what you’ve looked at, how you got there and just how it all fits together.
via
metaportaldermedienpolemik
other wikipedia visualization links via IBM’s Visual Communication Lab
just a quick link to a visualization of language spaces at MIT.
salut et merci a Christian pour le renseignement!