Archive for the 'visualization' Category

visualizing meaning

Tuesday, September 26th, 2006

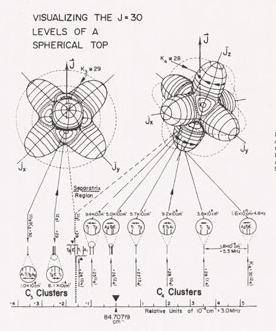
visualizingmeaninggross.jpg

From: “Rotational energy surfaces and high-j-eigenvalue structure of polyatomic molecules”, by W. G. Harter and C.W. Patterson, Journal of chemical physics, vol 80, 4241-4261 (1984)

There is a nice project at Cornell called visualizing meaning, which is a down-to-earth approach to the vast field of information visualization.

For the project all 1,943 Cornell Faculty were asked to respond to the following question:

Of the many charts (graph, map, diagram, table and ‘other’) you have seen in your life, which has been the most important, remarkable, meaningful or valuable?

(The above image had been submitted by a Mr. Greg Ezra.)

micro graphics

Monday, September 25th, 2006

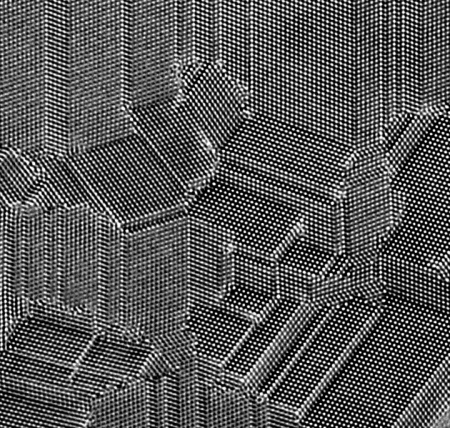
microskop.jpg

atomic resolution micrograph of multiple twinned nanocrystalline film of Si (C. Song) in the ncem gallery

This post is sort of a followup to e.g. this randform post as it covers the unseeable.

(more…)

glassy class

Sunday, September 24th, 2006
slide3.jpg

Science and the National Science Foundation were pleased to announce the winners of the fourth annual Science and Engineering Visualization Challenge.
We were very pleased to see a slide of our colleague Richard Palais together with Luc Bernard among the competition winners (see above image, First place for illustration). It shows wellknown mathematical surfaces in glassy style.

glassy science is hip —> see Melli Inks work via vvork

pipedream

Monday, September 18th, 2006

pipedreamdetail.jpg

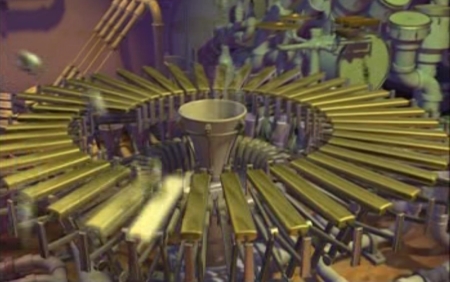
A classic in midi-to-graphics “generative” animation is “pipedream” by Dave Crognale and Wayne Lytle. It is sold together with other works by them on a DVD compilation via their website animusic. The “pipedream”-video itself is however also downloadable via the SIGGRAPH animation site on archive.org. However if you have an ATI graphics card you can render it also in realtime via the ATI rendering-gadgets sites for MAC and Windows.

Wayne Lytle has worked also in scientific visualization, e.g. on this mathematical visualization video for string theorist Brian Greene.

Blender Bullet Physics 2006 Contest

Monday, September 4th, 2006

bulletphysicsblog2.jpg

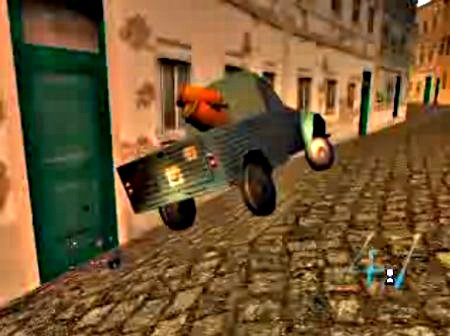
A good way to see some of the capabilities of blender‘s physics engine is to have a look at the outcome of the Bullet Physics 2006 Contest at this youtube link.
More info here.

Suzanne Vega in Second Life

Saturday, September 2nd, 2006

vega.jpg

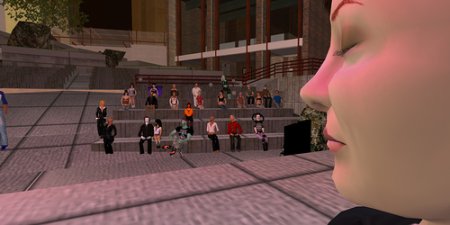
speaking about virtual architectural icons in my last post, it worthwhile to mention that the american company Lichtenstein Creative Media is organizing concerts and interviews in the commercial (and expensive) virtual environment called second life. On their webpage they currently feature a virtual concert with wellknown songwriter Suzanne Vega, including a machinima of her concert. If the link is gone — here is another youtube machinima of the concert.

Also MIT professor John Maeda was there. Reflecting on his second life experience in his blog, Maeda suddenly expressed his concern for mathematicians (thats how i interpret it ;)):

At the recent SIGGRAPH, one of the most popular talks was the fellow from i>SL where he spoke about the higher “emotional bandwidth” one gets with communicating through a fully-rendered avatar versus a pitful smiley like :-). Our resident media philospopher Burak took great offense at this comment. He felt that signs/symbols were invented not because we crave for constant realism in life, but that we can get engage deeper feeling through experiencing abstractions of reality. The more abstract the better, in his mind.

And that’s where it is: “in his mind.” Where the emotional bandwidth is truly the highest and where no computers (currently) can venture. To live without reality (or even a simulation of it) and to instead be immersed in a sea of symbols and even more abstract thoughts. Seems like one can go crazy in such a world.

So let’s wait for Madonna to appear there — would relieve her may be from the pressure to do cosmetic surgery for being an icon.

the impossible map

Thursday, August 17th, 2006

the impossible map

One of the first mathematical visualization clips if not the first is: the impossible map by Evelyn Lambart from 1947. In the film it is explained how to find coordinate maps for a sphere, partially exemplified with a grapefruit.

Evelyn Lambart is usually in the shadow of her frequent collaborator Norman McLaren, with whom she worked together in the fifties.

They both liked to play with graphical and likewise mathematical “entities”, like lines and shapes in the interplay with coulours:
Caprice en Couleurs (1949)
Around is Around (1951)
Horizontal Lines (1962)
Vertical Lines (1960)

But both have in their animations also more “lifelike” shapes, like birds and variation of birds, which are coloured but which are mostly “flat” reminding of “shadow figures” like e.g. in the animations of Charlotte Reiniger. This was partially due to their cut-out and scratching techniques. However also real life appears in their films. Evelyn Lambart did a lot of illustrative animations for other science films, but also for e.g. the film: A Chairy Tale, which reminds me of the earlier mentioned Georges Méliès. (Watch e.g. his film “Un homme de tete” from 1898, which is currently on youtube.com)

Remark: It seems that since two days there is Blinkity Blank by Norman McLaren on Youtube.com, and also parts of Prince Achmed by Lotte Reiniger. I dont know how long the films will be there, and what copyright problems are involved with them, thats why I dont link them.

update 11.10.10: An approximate and by no means accurate visual demonstration of the proposition that the area of a sphere is four times the area of its circular shadow (look also at this comment)

Take half an orange:
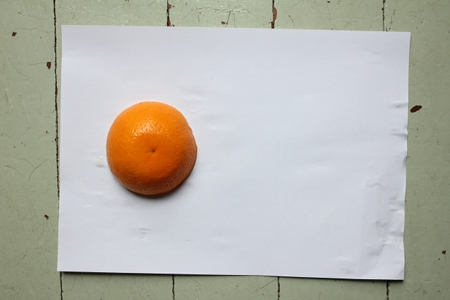
orange1-450-IMG_0381

Peel the half orange in a spiral. You peel the spiral in such a way that you go around twice in order to peel it fully, while keeping the width of the spiral arm (approx.) constant (that is you peel an archimedian or arithmetic speiral). By looking at the peeled orange one (more or less badly) sees that going around only once, one peeled off a part which covers roughly the area of the circular shadow:
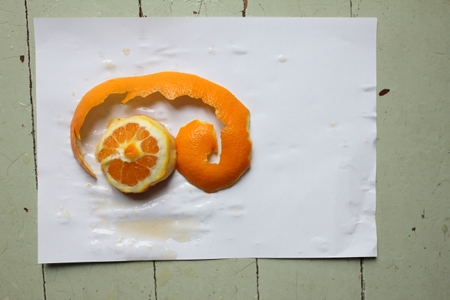
orange2-450-IMG_0382

Fold the spiral in the middle and put the two spiral halfs on top of each other:
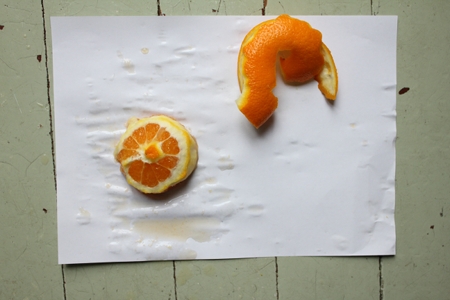
orange3-450-IMG_0383

One (again more or less badly) sees that the middle of the spiral is (approximately) at the point where the spiral had gone around once:
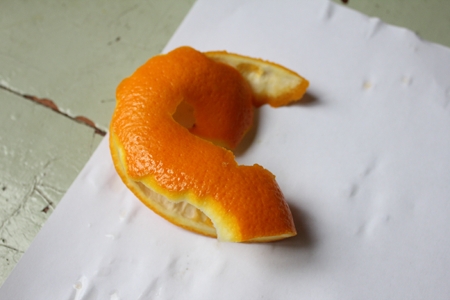
orange4-450-IMG_0384

So roughly one half of the spiral covers the area of half of half of an orange (because the two folded halfs of the spiral cover half an orange). In the meantime such a half also covered the circular shadow (i.e. that what you see by looking onto the orange from above), i.e. the second half was more or less perpendicular to the viewer and was thus (almost) not visible.
This is of course no prove of the proposition but gives only a rough feeling, that the proposition could be true.
symmetries IV (plain plane)

Monday, August 7th, 2006

wallpaper.jpg

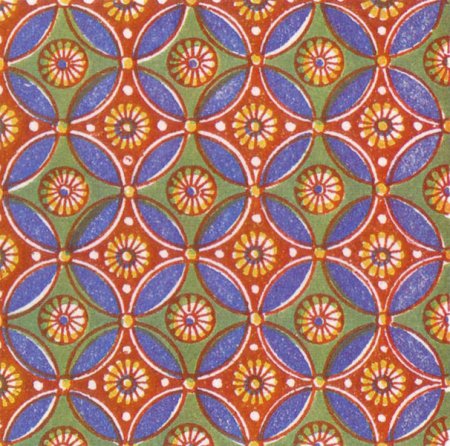
Example of wallpaper group type p4m. From The Grammar of Ornament (1856), by Owen Jones. Egyptian No 7 (plate 10), image #8 , wikipedia

A classic topic in intersections between math and art/design are tesselations. This is mostly due to the fact that the included math is almost completely visualizable, which can’t be said for most parts of mathematics.
(more…)

uncanny paintings

Thursday, August 3rd, 2006

facial.jpg

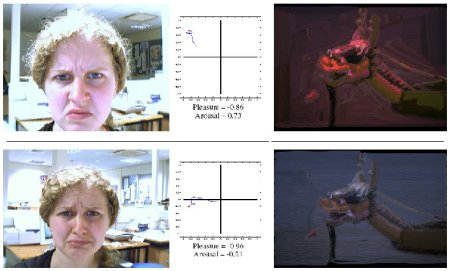
“empathic paintings” by Shugrina, Betke and Collomosse

(more…)

the uncanny valley

Tuesday, August 1st, 2006

uncannyvalley2.jpg

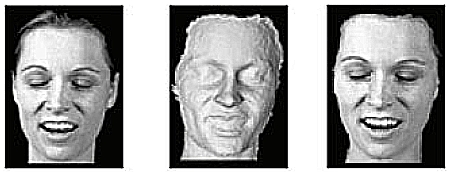
a) visible light video image, b) unvisible light fluorescent image, c) recontructed image according to the New York Times

Yesterday the New York Times as well as the Wall Street Journal published an article about a new motion capture device called “Contour” which was apparently shown at siggraph yesterday and which was developped by former Apple Computer engineer Steve Perlman.
(more…)