SPACED OUT
Thursday, August 19th, 2021Tim has made a new trailer for the Enigame 2021_2 puzzle hunt this fall – the spaced out edition.
randformblog on math, physics, art, and design |
Tim has made a new trailer for the Enigame 2021_2 puzzle hunt this fall – the spaced out edition.
For those who are interested in what keeps us busy – here is one thing: Local politics and in particular Berlin traffic planning.
If you are able to endure german subscripts you might watch our attempt to convince people that their ideas of traffic load removal may have the opposite effect of what they think.
If not -Tim had only very few hours to work on the music but you might just enjoy his lofty kind of ambient electronica.
Remark: The code as posted at the randform post ShutterSploshScatterPlots needs to include the new Content Security Policy.
That is you have to embed the following lines (at least thats how it worked here for the moment) into your html head:
<meta http-equiv="Content-Security-Policy" content="default-src 'self'; script-src 'self'">
<meta http-equiv="X-Content-Security-Policy" content="default-src 'self'; script-src 'self'">
<meta http-equiv="X-WebKit-CSP" content="default-src 'self'; script-src 'self'">
Moreover the javascript has to be pasted into a separate file and referenced accordingly within your html body, like for example as:
<script src="shutter.js" type="text/javascript"></script>
In case you feel a bit overcharged by all that – as a courtesy for you I quickly filmed the program output with my mobile and turned it into a gifanimation, which you can watch after the ” Read the rest of this entry”.
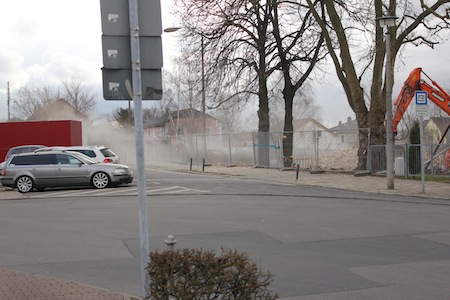
You might remember the post “Before and After” which was part of a series of posts, which were documenting the demolishment of a pub/restaurant/dancehall in the Berlin neighbourhood of Biesdorf, which belongs to the Berlin district of Marzahn-Hellersdorf.
The above image shows the train station S-Biesdorf. The former restaurant was located right behind the back of the fotographer. If you look at the post you should be able to assemble the space situation.

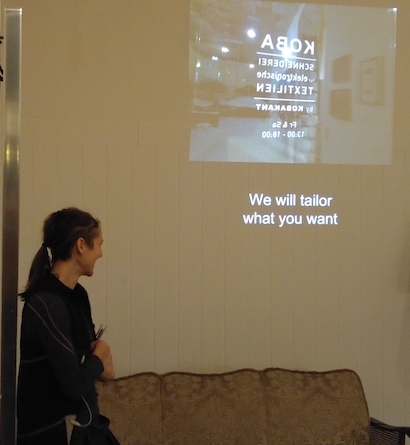
“We will taylor what you want ” Hannah Perner-Wilson explaining the shop concept of her and Mika Satomi’s new shop, the: “KOBA Maßschneiderei”
(more…)
Mohammad Ali (mohdali) had made a nice illustration of the socalled rolling shutter effect. He wrote a programm in javascript which uses the library d3 called Rolling shutter.
This program was used by artist Scriptique to program a kind of “paint-by-number recreational occupation for your browser” (as the artist called it). It should display something like “a paint drop dropping”.
The program has a MIT licence and you can see how well your browser paints by numbers by pasting the program into a file and then opening the file in your browser (tested with firefox).
Tim has to cope with an increasing workload, moreover heavy commuting also takes its toll, so he currently doesn’t get too much recreational time – even not on weekends. But over pentecost he now managed to create a nice drone with matching visuals.
A new astlab project, which comes closer to realize something which I have carried around in my head for now almost ten years.
 Ashes to ashes, dust to dust – remnants of the pub, as they are wafting over the railway tracks.
I am sorry to keep on talking about local politics. The pub from the last post has now been fully demolished. The little shops, which are adjacent to it are currently also under threat. A threat though of a slightly different sort.
With some help from Tim and on the occasion of the 2015 United Nations Climate Change Conference I did a visualization which combines local temperatures with methane data. The local temperatures are from the HADCRUT4 file, so they unfortunately stop in 2011. The methane data is from the website of the Earth System Research Lab. Unfortunately there are not so many methane measurements as there should be. In particular very few temperature stations have also made methane measurements, so I improvised a bit and joined some measurement points which are geographically close. The measurements are from Vestmannaeyar, Iceland; Alert Nunavut, Canada; Svalbard, Norway with temperatures from Lufthavn and CH4 from Ny Ålesund; Syowa, Antarctica and from Azores, Portugal, where the temperatures are from Santa Maria Island and the methane data is from Terceira Island (if I interpreted the station names correctly).
I have currently not so much Internet time left, partly because I currently have a job, where I have to sit a lot in front of a computer and partly because I have been trying to improve things in my local surroundings (partially as it seems in vain though) – so no long explanations. I hope you see at least what I see in the images above.
temperature curve: mean of anomalies (monthly deviations of values from monthly mean over measured time period, annual mean of that)
methane curve: annual mean of values