Archive for the 'software' Category

Sunday Drone

Wednesday, June 7th, 2017

Tim has to cope with an increasing workload, moreover heavy commuting also takes its toll, so he currently doesn’t get too much recreational time – even not on weekends. But over pentecost he now managed to create a nice drone with matching visuals.

Information about solar irradiance measurements sought

Thursday, January 12th, 2017


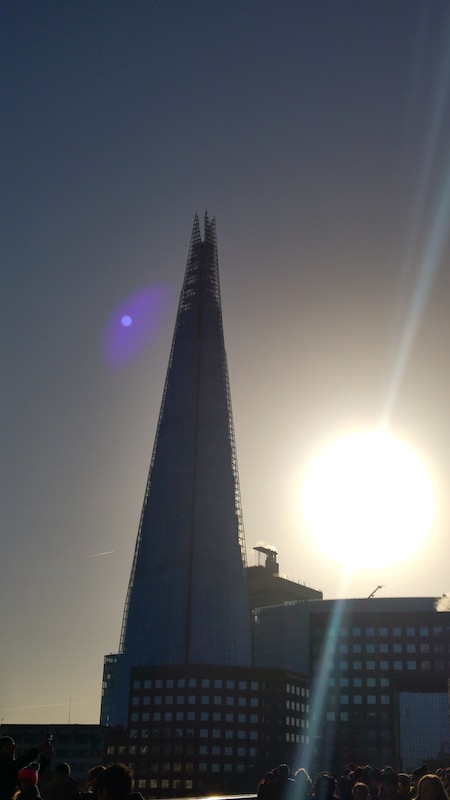
Planetary science at The Shard: How soon is the sun’s radiation going to be destructive? (apart from the effect on the CCD chip)

This blog post is based on a thread in the Azimuth forum.

The current theories about the sun’s life-time indicate that the sun will turn in about 5 billion years into a red giant. How and when this process is going to be destructive to earth is still debated. Apparently according to more or less current theories there has been a quasi linear raise in luminosity, quoting from p. 3 “Distant future of the Sun and Earth revisited” by K.-P. Schröder and Robert Connon Smith, 2008:

The present Sun is increasing its average luminosity at a rate
of 1% in every 110 million years, or 10% over the next billion years.

Unfortunately I feel a bit doubtful about this, in particular after I looked at some irradiation measurements.
But let’s recap a bit.

In the Azimuth forum I asked for information about solar irradiance measurements. Why I was originally interested in how bright the sun is shining is a longer story, which includes discussions about the global warming potential of methane. For this post I prefer to omit this lengthy historical survey about my original motivations (may be I come back to this later) – meanwhile (see above) there is an also a newer reason why I am interested in solar irradiance measurements, which I want to talk about here.

Strictly speaking I was not only interested in knowing more about how bright the sun is shining, but how bright each of it’s “components” is shining, i.e. I liked to see spectrally resolved solar irradiance measurements and in particular measurements from a range between roughly the frequencies* 650nm and 950nm.

So I had found the Sorce mission, which is a NASA sponsored satellite mission, whose website is located at the University of Colorado. The website provides very nicely an interactive part with a fairly clear and intuitive LISIRD interactive app with which the spectral measurements of the sun can be studied.

As a side remark I should mention that this NASA mission belongs to the NASA Earth Science mission, which is currently threatened to be scrapped.

By using this app I found in the 650nm and 950nm range a very strange rise in radiation between 2003 and 2016 which happened mainly in the last 2-3 years. Here you can see this rise:
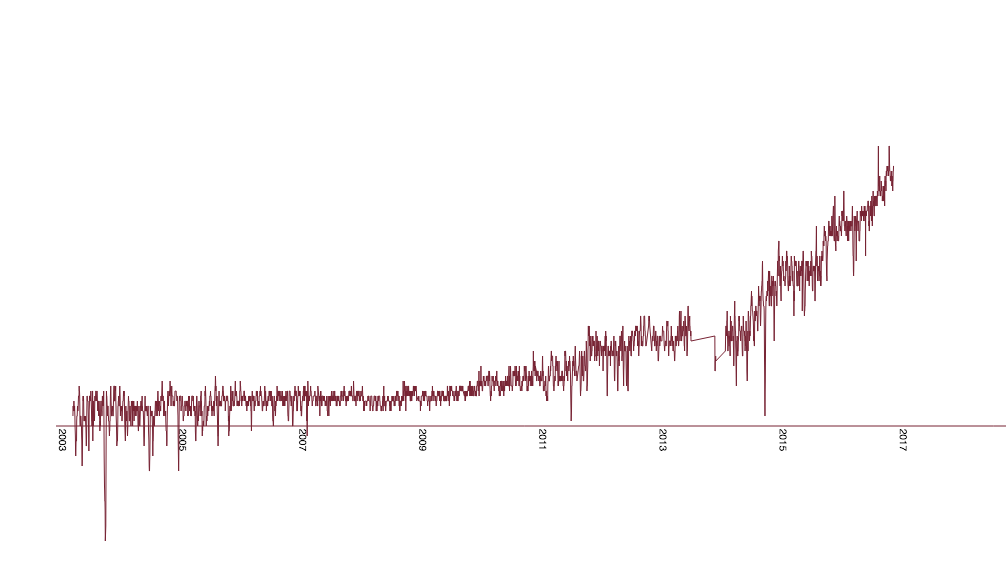

spectral line 774.5nm from day 132 to 5073, day 132 starting Jan 24 in 2003, day 5073 is end of 2016

Now, fluctuations within certain spectral ranges within the sun spectrum are no news, however here it rather looked as if a rather stable range suddenly started to change rather “dramatically”.

I put the word “dramatically” in quotes for a couple of reasons.

Spectral measurements are complicated and prone to measurement errors. Alone the subtle issue of dirty lenses etc. suggests that this is no easy feat and that so this strange rise might easily be due to a measurement failure. Moreover as said it looked as this was a fairly stable range over the course of ten years, but maybe this new rise in irradiation is part of the 11 years sun cycle, i.e. a common phenomenom. In addition, although the rise looks big it may overall still be rather subtle.

But so – how subtle or non-subtle is it then?

In order to assess that question I made a quick estimation (see forum discussion) and found that if all the additional radiation would arrive on soil (which of course it doesn’t due to absorption) than on 1000 sqm you could easily power a lawn mower with that subtle change! I.e. my estimation was 1200 W for that lawn patch. WOA!

That was disconcerting enough to download the data and linearly interpolate it and calculate the power of that change. I programmed a calculation program in javascript for that. The computer calculations revealed 1000 W, i.e. my estimation was fairly close. WOA again!

How does this translate to overall changes in solar irradiance? Some increase had already been noticed. NASA wrote 2003 on it’s webpage:

Although the inferred increase of solar irradiance in 24 years, about 0.1 percent, is not enough to cause notable climate change, the trend would be important if maintained for a century or more.

That was 13 ys. ago.

I now used my program to calculate the irradiance for one day in 2016 between the frequencies 180.5nm and 1797.62nm, i.e. about a quite big part of the solar spectrum and got the value $latex 627 W/m^2$ and computed the difference to one day in 2003 and got $latex 0.61 W/m^2$, which is 0.1% in 13 years, rather then 24 years. But of course this is no average and fluctuations play a big role in some parts of the spectrum, but well – this may indicate that the overall rate (!) of rise in solar radiation may have doubled. And concerning the question of the sun’s luminosity: for assessing luminosity one would need to take the concrete satellite-earth orbit at the day of measurement into account, as the distance to the sun varies or at least average – but still, on a first glance this appears disconcerting.

Moreover for this specific range I mentioned above I calculated the value $latex 192 W/m^2$ for day in 2016 (day 5073), so this would mean for this frequency range the increase in 13 ys was about 0.5% and most of it in the last 2-3 years.

Given that this spectral range has e.g. an overlap with the absorption of water (clouds!) this should at least be discussed.

And indeed one can even see the rise in this range within the solar spectrum without zooming in. See how the spectrum splits into a purple and dark red line in the lower circle?
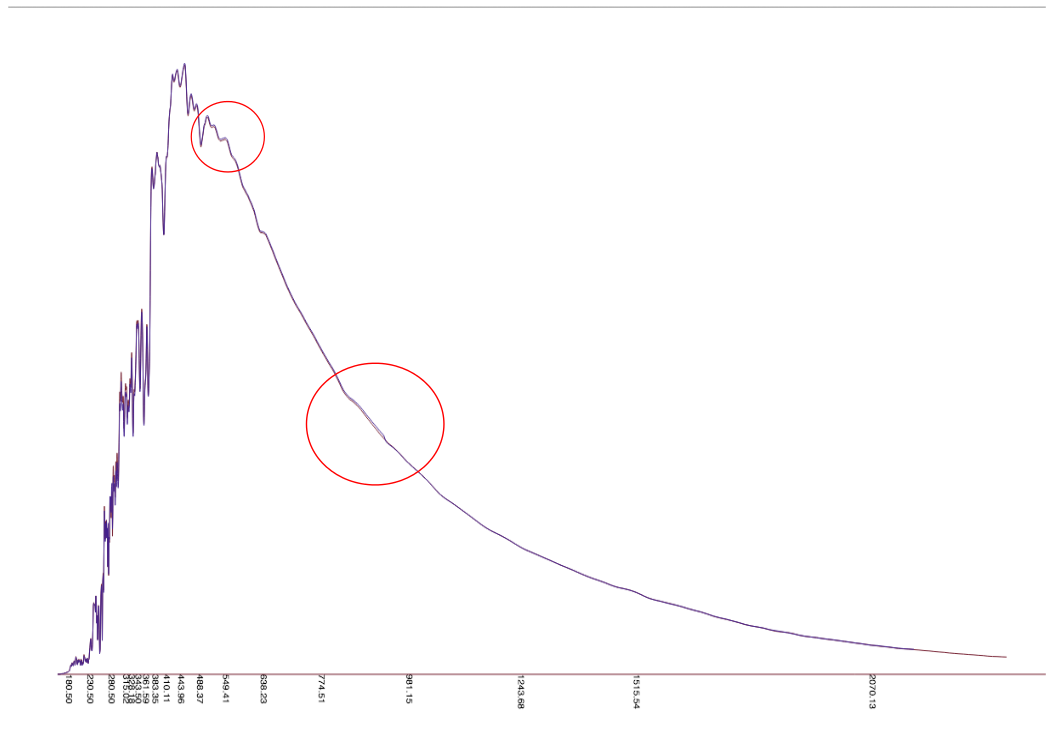

Difference in spectrum between day 132 and 5073

The upper circle display another rise, which is discussed in the forum.

So concluding all this looks as if this needs to be monitored a bit more closely. Finally the theories about the lifetime of the sun are only theories.
In particular it would be important to see wether these rises in irradiance are also displayed in other measurements, so I asked in the Azimuth Forum, but sofar got no answer.

The russian wikipedia site about solar irradiance contains unfortunately no links to russian satellite missions (if I haven’t overseen something) and there exists no chinese or indian wikipedia webpage about solar irradiance. I also couldn’t find publicly accessible spectral irradiance measurements on the ESA website (although they have some satellites out there) and wrote in December an email to the head of the section solar radiometry of the World Radiation Center (WRC) Wolfgang Finsterle with no answer yet.

In short if you know about publicly available solar spectral irradiance measurements other than the LISIRD ones then please let me know.

update Jan 15, 2017: This post appeared also as a guest post on John Baez blog Azimuth with minor modifications, in particular the english was polished by John.

correction Feb, 3, 2017: * frequencies should read inverse spatial frequencies or simply wavelength

update Mar 4, 2019: There is an update to this post at randform post: What is going on at the Sun?
xOSC keygloves

Sunday, December 4th, 2016

In the randform post “Gesture steered Turing machine” I used data gloves, which were made following the instructions of Hannah Perner-Wilson who is a member of the gloves project. Being weary of sitting too much at the computer I had also written in this post that I would like to make more use of body movements and in particular include danse-like movements in computer interaction and in particular in programming.

Unfortunately rather shortly after I had written the post a not so nice medical indication in my vicinity which was -at least partially- due to too much computer sitting urged me to more or less dramatically speed up this project.

The gesture recognition for my gloves, which were used in the Turing machine example, works, but it is not yet fine grained and exhaustive enough. So I had to look for an easy and fast and at least to some extend workable and affordable solution which would insure a more direct and precise steering possibility, like some version of key gloves. To make it short: In the end I made my own version with Tims help. Again it’s only a start but still.

(more…)

Gesture Steered Turing Machines

Friday, July 1st, 2016

A new astlab project, which comes closer to realize something which I have carried around in my head for now almost ten years.

(more…)

Alert, Nunavut etc.

Saturday, November 28th, 2015

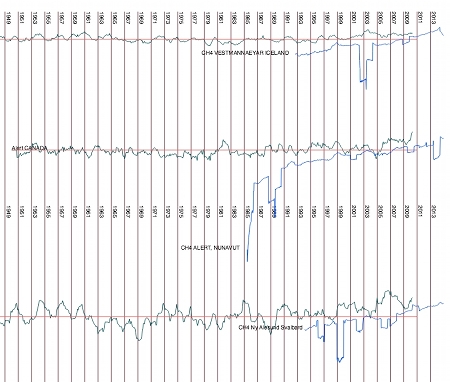
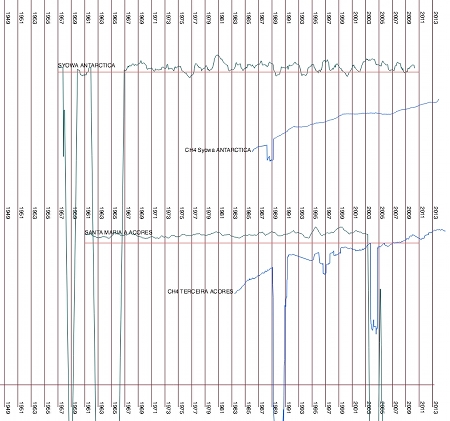
With some help from Tim and on the occasion of the 2015 United Nations Climate Change Conference I did a visualization which combines local temperatures with methane data. The local temperatures are from the HADCRUT4 file, so they unfortunately stop in 2011. The methane data is from the website of the Earth System Research Lab. Unfortunately there are not so many methane measurements as there should be. In particular very few temperature stations have also made methane measurements, so I improvised a bit and joined some measurement points which are geographically close. The measurements are from Vestmannaeyar, Iceland; Alert Nunavut, Canada; Svalbard, Norway with temperatures from Lufthavn and CH4 from Ny Ålesund; Syowa, Antarctica and from Azores, Portugal, where the temperatures are from Santa Maria Island and the methane data is from Terceira Island (if I interpreted the station names correctly).

I have currently not so much Internet time left, partly because I currently have a job, where I have to sit a lot in front of a computer and partly because I have been trying to improve things in my local surroundings (partially as it seems in vain though) – so no long explanations. I hope you see at least what I see in the images above.

temperature curve: mean of anomalies (monthly deviations of values from monthly mean over measured time period, annual mean of that)
methane curve: annual mean of values

Volt ohne Raum

Wednesday, October 21st, 2015


Organic lettuce in Brandenburg

(more…)

netzpolitik

Saturday, August 1st, 2015

I am quite shocked to hear that two bloggers from the blog netzpolitik, namely the here already mentioned Markus Beckedahl and the blogger André Meister were accused of treason for reports and the publication of some apparently classified information related to projects connected with a project called after the greek Perseus. The projects have amongst others a component which deals with the mass surveillance of social networks by german intelligence. Treason is to be punished with at least one year in jail if I understood correctly. I briefly read the various reports at netzpolitik (for time reasons in a rather diagonally manner) and I found nothing which could remotely justify such charges in my point of view. That is the presentations there describe a rough organistorial setup in which rather unspecified general tasks, like coordinization, consulting etc. are mentioned. The documents and reports thus give a very sketchy outline about the rough size and – in particular- costs of the projects (which seems to be rather of interest to the tax payer), but nothing really concrete.
The investigation is currently suspended and I hope that the charges will be dropped.

Showa Values

Wednesday, March 25th, 2015


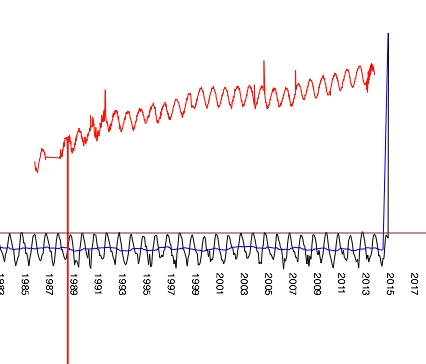
The investigation of methane and temperature values is still going on. Here a discussion on Azimuth about Antarctica (which to quite some extend concerned with where and how to get measurement values) and here a screenshot of a recent javascript document by Tim and me, sort of envisaged to be posted soon, eventually also with other measurements. The document shows the temperature and methane values of the japanese station Showa (Syowa) (webcam).

visibility deterioration of deterioration

Thursday, September 18th, 2014

Unfortunately our temperature visualization from last post is currently not running anymore. Probable reason: It currently seems that WebGl Earth has moved two library files. In particular the WebGl earth API base script which we were thinking was self-contained unfortunately doesn’t seem to be self-contained. We are going to look at this trouble in the near future.

supplement 05.10.2014: The interactive visualization is currently working again. Klokan technologies had responded and promised to look into this problem.

detoration explordaration

Tuesday, September 2nd, 2014

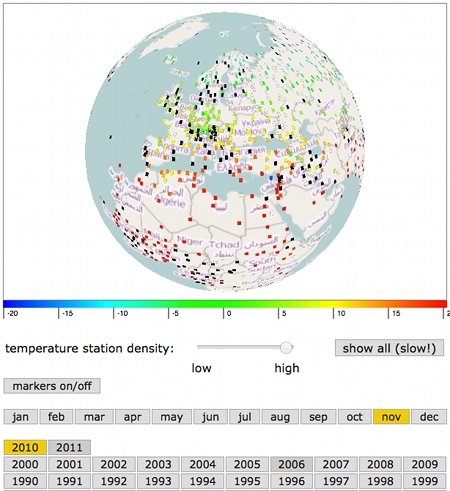
As was announced in the last post Tim and me were working at a visualization of the data collection CRUTEM 4 by the climate research unit (CRU) at the University of East Anglia. In the post it was mentioned that the data in that collection was sort of “deteriorating”. That is on one hand the number of active temperature measurement stations which were listed in this file (some stations started measuring already in the 18th century) decreased rather rapidly in the last ten years and/or the file contained increasingly invalid/no temperature data in the last ten years.

In that context it is worthwhile to note that CRUTEM 4 supercedes CRUTEM 3 and the CRUTEM 3 (grid data) was according to the Intergovernmental panel on Climate Change (IPCC) used for the IPCC fourth assessment report (AR 4).

Wether the “deterioration of that CRUTEM 4 data” has any effect on the assessment of the current global warming trends is another question. The application is now online. Explore yourself! Caution the data takes very long to load. The CRUTEM 4 data file is about 45 MB.

The following two interactive applications also display global temperature data:

– HADCRUT 3 (which uses CRUTEM 3) data is visualized here by Cliff Best.

NOAAs Global Historical Climatology Network-Monthly (GHCN-M) is visualized here by Nick Stoves.

– our comparision of temperature anomalies, CO2 and methane values uses HADCRUT 4 which uses CRUTEM 4 and HadSST3 (sea surface temperatures).

warning: 18.10.2014
Unfortunately the application is currently not running anymore. Probable reason: It currently seems that WebGl Earth has moved two library files. In particular the WebGl earth API base script which we were thinking was self-contained unfortunately doesn’t seem to be self-contained. We are going to look at this trouble in the near future.

supplement 05.10.2014: The interactive visualization is currently working again. Klokan technologies had responded and promised to look into this problem.