Archive for the 'physics' Category

keep gift wrapping (Update)

Tuesday, December 23rd, 2014

You have probably seen this video where the duchess Kate Middleton rolls her eyes after being told “keep wrapping” during a charity visit within the US. Since it is the holiday season randform now proudly presents the exclusive footage on WHAT the duchess was actually told to wrap.

(more…)

LeContest

Tuesday, November 25th, 2014

We here at randform are superexcited to present our first reader randform mega contest – simply called LeContest !!

(more…)

detoration explordaration

Tuesday, September 2nd, 2014

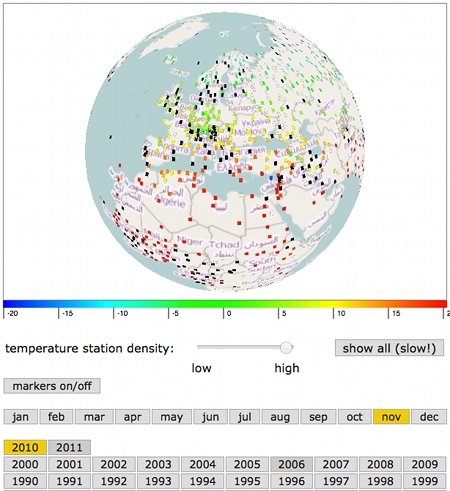
As was announced in the last post Tim and me were working at a visualization of the data collection CRUTEM 4 by the climate research unit (CRU) at the University of East Anglia. In the post it was mentioned that the data in that collection was sort of “deteriorating”. That is on one hand the number of active temperature measurement stations which were listed in this file (some stations started measuring already in the 18th century) decreased rather rapidly in the last ten years and/or the file contained increasingly invalid/no temperature data in the last ten years.

In that context it is worthwhile to note that CRUTEM 4 supercedes CRUTEM 3 and the CRUTEM 3 (grid data) was according to the Intergovernmental panel on Climate Change (IPCC) used for the IPCC fourth assessment report (AR 4).

Wether the “deterioration of that CRUTEM 4 data” has any effect on the assessment of the current global warming trends is another question. The application is now online. Explore yourself! Caution the data takes very long to load. The CRUTEM 4 data file is about 45 MB.

The following two interactive applications also display global temperature data:

– HADCRUT 3 (which uses CRUTEM 3) data is visualized here by Cliff Best.

NOAAs Global Historical Climatology Network-Monthly (GHCN-M) is visualized here by Nick Stoves.

– our comparision of temperature anomalies, CO2 and methane values uses HADCRUT 4 which uses CRUTEM 4 and HadSST3 (sea surface temperatures).

warning: 18.10.2014
Unfortunately the application is currently not running anymore. Probable reason: It currently seems that WebGl Earth has moved two library files. In particular the WebGl earth API base script which we were thinking was self-contained unfortunately doesn’t seem to be self-contained. We are going to look at this trouble in the near future.

supplement 05.10.2014: The interactive visualization is currently working again. Klokan technologies had responded and promised to look into this problem.

Periodicity

Sunday, June 22nd, 2014

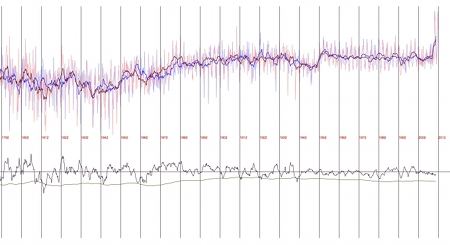
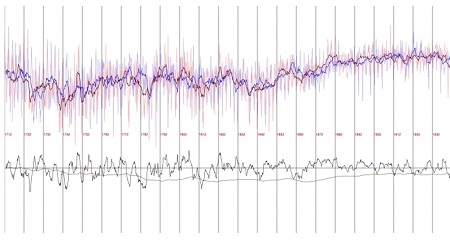
This concerns a discussion on Azimuth. I found that the temperature anomaly curve, which describes the global combined land [CRUTEM4] and marine [sea surface temperature (SST)] temperature anomalies (an anomaly is a deviation from a mean temperature) over time (HADCRUT4-GL) has a two-year periodicity (for more details click here). The dots in the above image shall display, why I think so. The dark line drawn over the jagged anomaly curve is the mean curve. The grey strips are one year in width. A dot highlights a peak (or at least an upward bump) in the mean curve. More precisely there are:

18 red dots which describe peaks within grey 2-year interval
5 yellow dots which describe peaks out of grey 2-year interval
(two yellow peaks are rather close together)
1 uncolored dot which describes no real peak, but just a bump
4 blue dots which describe small peaks within ditches

One sees that the red and yellow dots describe more or less all peaks in the curve (the blue dots care about the minor peaks, and there is just one bump, which is not a full peak). The fact that the majority of the red and yellow dots is red, means that there is a peak every 2 years, with a certain unpreciseness which is indicated by the width of the interval.

Upon writing this post I saw that I forgot one red dot. Can you spot where?

Especially after doing this visualization this periodicity appears to me meanwhile so visible that I think this should be a widely known phenomenom, however at Azimuth nobody has heard yet about it. If its not a bug then I could imagine that it could at least partially be due to differences in the solar irradiance for northern and southern hemissphere, but this is sofar just a wild guess and would need further investigations, which would cost me a lot of (unpaid) time and brain. So if you know how this phenomen is called then please drop a line. If its not a bug then this phenomen appears to me as an important fact which may amongst others enter the explanation for El Niño.

Aimbottleneck

Tuesday, April 8th, 2014


Title: “Kreative Mode beim Bedrockabgrundste-in”, oil on canvas, artist: Mudda Prahler

There was recently a post on Gamasutra with the title: Titanfall: Why Respawn is punishing cheaters. The computer game Titanfall is a First person shooter that can be played with a couple of people in one environment. Wikipedia describes it as follows:

Players fight either on foot as free-running “Pilots” or inside agile mech-style walkers called “Titans” to complete team-based objectives[2][3] on a derelict and war-torn planet[4] as either the Interstellar Manufacturing Corporation (IMC) or the Militia.[5]

I don’t know Titanfall (In general I have been playing first person shooters rather rarely) but what apparently happened was that there where too many people cheating in the game.

In the post it isn’t really described what exactly is implied by cheating, but what I refer from the “punishment” announcement, I think what was happening was that some people used game bots and in particular socalled aimbots, which are software solutions which make shooting easier in such a game. From the Titanfall announcement:

You can play with other banned players in something that will resemble the Wimbledon of aimbot contests. Hopefully the aimbot cheat you paid for really is the best, or these all-cheater matches could be frustrating for you. Good luck.

I was asking myself though wether this action is part of some viral marketing campaign. That is that some cheaters could think that it could be way cooler to “win the Wimbledon of aimbot contests” rather than the usual game. Given that Titanfall had however performance problems which as it seems where due to overloaded game servers and connections, it doesn’t though look as if this would improve with aimbot contests.

In this context:

In a citation about a report by a tech- and investment-advisory firm in the time article: The Surprisingly Large Energy Footprint of the Digital Economy

In his report, Mills estimates that the ICT system now uses 1,500 terawatt-hours of power per year. That’s about 10% of the world’s total electricity generation

The New York times article: Power, Pollution and the Internet remarks the following about e.g. US data centers:

Nationwide, data centers used about 76 billion kilowatt-hours in 2010, or roughly 2 percent of all electricity used in the country that year, based on an analysis by Jonathan G. Koomey, a research fellow at Stanford University who has been studying data center energy use for more than a decade. DatacenterDynamics, a London-based firm, derived similar figures.

A summary of the last IPCC report about climate change and global warming.

and:

In Berlin there is currently the International games week Berlin.
Generation Z: Renoise

Sunday, February 16th, 2014

IMG_0644.JPG

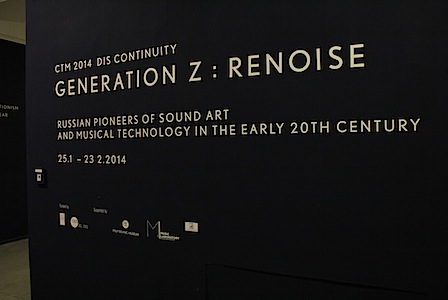
For Berliners and those who can afford to go to Berlin for a quick trip I would like to mention an absolute must see exhibition, namely the exhibition Generation Z: Renoise about the russian musical avantgarde in the 20s and later which is curated by L. Pchelkina, A. Smirnov, P. Aidu, K. Dudakov-Kashuro and E. Vorobyeva. The exhibition is unfortunately not as highly promoted as it should – given how fabulous it is! I hope that this post makes some more people visit it. It is definitely worth it! The exhibition is in the Künstlerhaus Bethanien, Kunstraum (unfortunately not so easy to find), it runs until Feb.23, 2014. It is free of entrance and open from 12:00-19:00 o clock.

The exhibition has the themes: Projectionism and Radio-ear, Revasavr, GIMN Institute, Theremin, Graphical Sound, Industrial Noise Machines, Amateur Noise Instruments and Destruction of Utopia. Below is a small excerpt from the respective themes. A lot of details can also be found in Andrei Smirnov’s book “Sound in Z“.

(more…)

Surveillance surfing

Tuesday, December 3rd, 2013


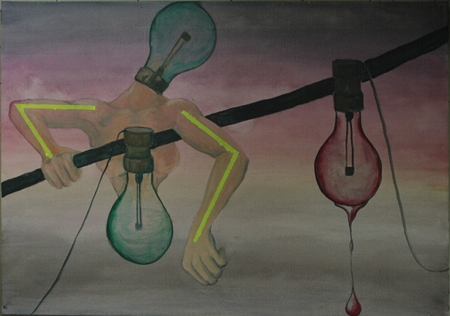
Glowlum tapping along a dull wire, artwork by Hucky Finn, oil on canvas, inspired by a photography by Baertels, www.plainpicture.com.

There have been quite some discussions here in Germany about the revelations about the surveillance of ordinary citizens and the protection of ordinary citizens data in general.

(more…)

About wood burning

Wednesday, September 18th, 2013


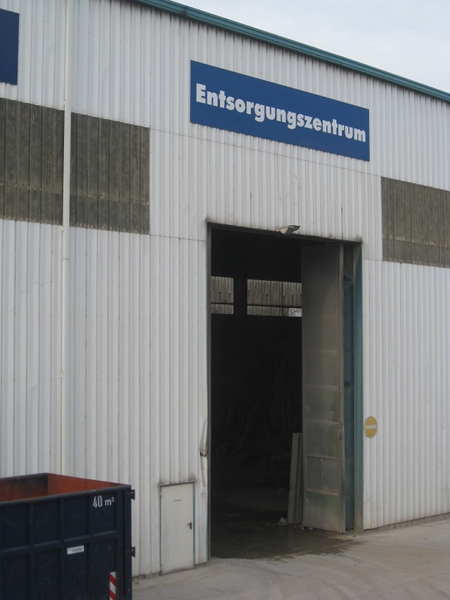
Waste disposal facility in Berlin. The german word “Entsorgung” means literally: getting rid of sorrows

John Baez has a new blog post about Europe using wood burning for energy generation. My comment to the blog post is rather detailled and it is also a comment to the currently ongoing debate in Berlin about how to organize its energy supply. This debate was initiated by the socalled Berliner Energietisch (unfortunately not yet in english) so I thought I should maybe post the comment also here.

(more…)

Have an exclusive look!

Monday, July 29th, 2013

Here you get an exclusive look behind the randform (iron ;)) curtain:

Tim’s latest free time projects were heavily located in music electronics. His last weekend project was to use a socalled x-OSC chip (which he is currently beta testing) by the british company x-io technologies (see blue blinking board in the video) as a wireless remote control for a socalled ladder filter (unfortunately a bit hard to see in the wirings on a kitchen table…).

how to sew the vmeter sleeve

Monday, April 1st, 2013

Tim’s midi-osc article has now an explanation on How to sew the vmeter sleeve and a video which shows the wireless vmeter in action: