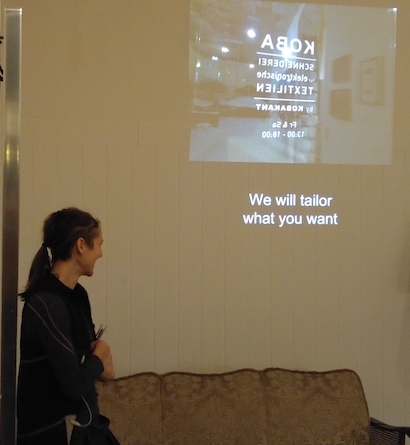
We will tailor what you want
Thursday, December 28th, 2017
“We will taylor what you want ” Hannah Perner-Wilson explaining the shop concept of her and Mika Satomi’s new shop, the: “KOBA Maßschneiderei”
(more…)
randformblog on math, physics, art, and design |

“We will taylor what you want ” Hannah Perner-Wilson explaining the shop concept of her and Mika Satomi’s new shop, the: “KOBA Maßschneiderei”
(more…)
pan and zoom as usual
In 2006 Tim played around with swarm simulations in processing and ended up with funny flush like settings. We tweaked the parameters in such a way that it ended up looking like and sounding like a galaxy being flushed down the drain and made it into the art work “dipper galaxy flush” where dipper refers to the wellknown patterns in the constellation Ursa Major. Our comment wasn’t though referring to a particular galaxy there but to galaxies in general – which could include our own.
If you look at the processing code you see that Tim’s simulation doesn’t use e.g. Newtonian gravity, although Tim used a force which is similarily “centralizing” as dark matter.
Inspired by discussions about dark matter and dark energy and general relativity at John Baez’ social media I wanted to get a feeling of how important the feature of dark matter is in order to allow for galaxy formation.
The above is a realtime javascript simulation using purely newtonian gravity with no dark matter but two giant masses (indicated by blue circles, which size is not proportional to the smaller circles) and something that could be called an “inelastic binding”. That is if the distance between masses is smaller than some number then those “close-by” masses behave as if they stuck together as in an inelastic collision, or in other words: the velocity of a mass is set to be the weighted average velocity of the close-by masses (details in the code, how much inelastic collision you want is set by the parameter “mix”).
It was acutally not so easy to find a configuration which somewhat mimicks galaxies, but the above looks a bit as if, I find. If I find the time I may add a 3D viewer. Try yourself – the source code is open.
Here how a scientifically advanced galaxy simulation, which includes dark matter looks on a super computer: World’s first realistic simulation of the formation of the Milky Way and here an interview with the author Lucio Mayer. Just like us many other users think it looks like a filmed flush – if you read the comments.
Here another simulation by Fabio Governato on his youtube channel: The Formation of a Milky Way like Galaxy. He has a whole variety of galaxy formation videos.
remark: the simulation is a modification of Mike Bostocks canvas swarm simulation at https://bl.ocks.org/mbostock/2647922
update 1.12.2017: There was a mistake in the addition of the z-speed, which is now corrected in the above version. Luckily the correction did affect the overall appearance only slightly.
![]()
In an earlier randform post I mentioned the connection of methane emissions and geological features. In particular in an area called Vestnesa which is about northwest of Svalbard (look at image 3) high methane emissions were due to plate tectonics. In that post I asked wether this fault couldn’t be eventually part of a plate which arises from a break of the Eurasian plate, i.e. in particular whether there are similar plate tectonical ongoings along the (northern part of) Ural. I was in part drawn to that question because of the above image. In the above image you see a plume (CH4 air masses) starting at the Kara sea and then going down south in the west of a line, which seems to indicate the Ob river. I.e. this plume seems to be going down at least along the northern part of the Ural mountains. The image is on a world scale so this is a bit speculative, but still, it looks as if. But since the resolution is so crude it should also be mentioned that east of the Ob there are major gas fields, like at Novy Urengoy.
(more…)
Mohammad Ali (mohdali) had made a nice illustration of the socalled rolling shutter effect. He wrote a programm in javascript which uses the library d3 called Rolling shutter.
This program was used by artist Scriptique to program a kind of “paint-by-number recreational occupation for your browser” (as the artist called it). It should display something like “a paint drop dropping”.
The program has a MIT licence and you can see how well your browser paints by numbers by pasting the program into a file and then opening the file in your browser (tested with firefox).
A reoccurring question on randform is: how stable is the current ecosystem on earth? And in particular how stable is it as a not too hostile environment for humans?
A possibility to find out is to isolate living systems.
Some of these experiments of such (more or less) closed artificial ecosystems were mentioned in the 2006 randform post Mars on earth.
And at least one of these long-term experiments more or less partially failed (namely the First mission of Biosphere 2) because, as the Pittsburgh Post-Gazette wrote: Biosphere 2 members “aired out”:
With an admitted leakage rate of just under 10 percent of its atmossphere yearly, oxygen levels inside dropped gradually over the project’s first 15 months, eventually reaching the levels normally found atop a 13,400-foot mountain. Because the oxygen loss was gradual, the crew members were able to continue functioning but their physical activities were eventually reduced to about 70 prcent of normal because of oxygen deprivation before project staffers outside injected more air.
As far as I know the major reasons, why the oxygen levels dropped were never fully established.
The reasons given in the Pittsburgh are differing from what I thought and wrote about the major reasons in the Mars on earth blog post:
the air supply had to be reenforced due to a miscalculation of the air consumption of bacteria in the soil of the greenhouse
where in retrospective I am unfortunately not sure, whether this reason about the decline of oxygen was given in the TV documentation which I had seen about Biosphere 2 or whether this was just my own interpretation of what had most probably happened.
So the question about the stability of the earth ecosystem is last but not least a question of O2 or not O2. And the balance of very tiny organisms may play a very major role in that question.
So amongst others in the post How much O2 will be left? I suggested that
“melting of permafrost could not only lead to more CO2 in the air but also induce a reagression of O2 (which may e.g. be due to a sudden expansion of aerobic organisms)*”
There are also other randform posts which intrinsically look at the O2 (and also CO2) balance. In particular some posts are dedicated to the oceans via studying phytoplankta.
Like the 2009 post about “The tragedies of marine towns” or the 2010 post about phytoplankton decline. Amongst others the posts illustrate again how complicated it is to infer any future developments, and that is even not easy to monitor the developments of microorganisms. Whatsoever -it seems that rather big changes may be underway, which may point to an out-of-balance situation. But as said this is an ongoing discussion and e.g. the phytoplankton post needs to be updated with the finding that it seems (following an article in the new scientist ) that
The rate at which phytoplankton are disappearing as oceans warm has been vastly overestimated by a glitch in models.
And in particular that
Increased CO2 concentrations often have competing positive and negative effects on phytoplankton, with winners and losers among different species.
Where especially the abundance of diatoms seems to be controversial.
That is the NASA study from 2015 Sept. 23 in Global Biogeochemical Cycles sees a clear decline at least in northern regions, while Nature (pay wall) finds:
Climate change enhances diatom growth mainly owing to warming and iron enrichment, and both properties decrease cellular nutrient quotas, partially offsetting any effects of decreased nutrient supply by 2100.
There are some possibilities to get a better overview over the stability of ecosystems from an more abstract viewpoint (see e.g. this article on Quanta) but still.
And because the balance of the microorganisms is so complicated (and in fact heavily influenced by human activity even in a rather direct way (see e.g. algae fuel)) and since models are only models it is important to conduct concrete experiments with closed ecosystems and at least to monitor direct physical quantities like oxygen levels.
So in fact by looking at visualizations of oxygen concentration in various years at NOAA it had been written in another randform post of 2014 that oxygen saturation in the ocean especially in the north seemed to have declined and eventually likewise the oxygen concentration in the air.
Do we know more now?
Unfortunately it seems things got rather worse. That is despite the fact that meanwhile there had been flamboyant announcements by various people to establish even settlements on Moon and Mars, it seems research on closed environments is rather in decline (a brief update here). That is it seems BIOS 3 closed now for real (thats how it sounded following an article in novosti kosmonavtiki) and the last experiments in the direction of a closed system seem to have been the Yuegong-1 mission in May 2014, but maybe I oversaw something.
Worse however seems to me the fact that NOAA seems to have ceased to produce visualizations of the oxygen concentrations.
Is that true?
At least there seem still to be people who look at things. That is in a recent article my observation in this randform post about the decline in oxygen levels was confirmed. (via CNN)
The confirming article is behind a paywall but if you click on the link in the CNN article it is momentarily visible and it’s written:
We find that the global oceanic oxygen content of
227.4 ± 1.1 petamoles (10^15 mol) has decreased by more than two per cent (4.8 ± 2.1 petamoles) since 1960, with large variations in oxygen loss in different ocean basins and at different depths.
and
Five distinct regions with significant oxygen loss stand out that cannot be attributed to solubility changes. These are (1) tropical regions of all basins, which contain most of the upper ocean OMZ, (2) the North Pacific, (3) the South Atlantic, (4) the Southern Ocean and (5) the Arctic Ocean (Table 1, Fig. 1b, Extended Data Fig. 4).
The authors likewise see microorganisms as a potential major cause for the decrease:
This suggests that either multi-decadal variations or changes in ocean circulation induced ventilation, potentially
enhanced by increased upper ocean biological activity, are responsible
for the observed changes in oxygen below 1,000 m.
However as far as I understood their data went only until 2010 and my alarming observation was from the change between 2009 and 2013.
AccèsCotes is a new experiment within the series “body control”, which explores amongst others (dance-like) body movements as computer-input languages.
The principle tongue-in-cheek idea behind it was to self-enforce more body movements via placing the “buttons” of a keyboard on different garment items/accessories (like by e.g. having the buttons for the vowels on a bag, the delete button on another accessory and the rest on the trousers). The experiment was invited to participate at the Berlin Fashion hackday 2017.
In the xOSC Keygloves input was made via conductive contacts and in the gesture steered Turing machine the input was made via hand gestures and their screening via bend sensors, this time capacitive sensors were used.
More details and code on the astlab page.
Tim has to cope with an increasing workload, moreover heavy commuting also takes its toll, so he currently doesn’t get too much recreational time – even not on weekends. But over pentecost he now managed to create a nice drone with matching visuals.
After a brief history of the radio technology museum Königs-Wusterhausen on the “Funkerberg” (“broadcast hill”) and an overview on the impressive Dieselgenerator here now part 3 of the series. Part 3 deals a bit with the radio broadcasting itself and in particular with the role it played within my family.
(more…)

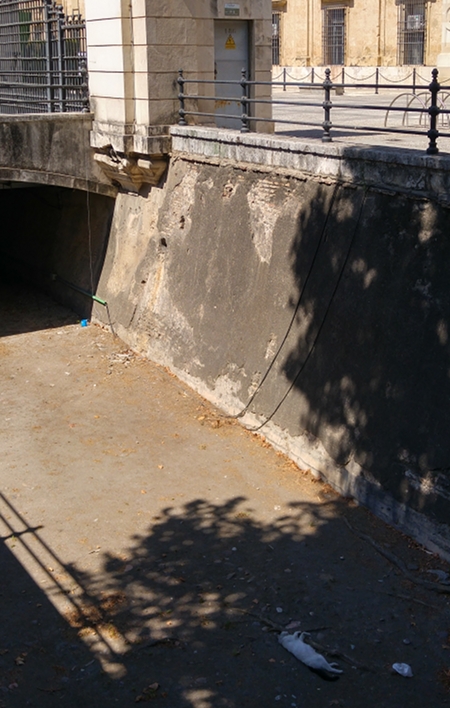
Very dead looking cat in front of the Universidad de Sevilla
I didn’t go to the march for science.

“End-Hauptbereichsverspannungsmedikamente für Nacknmuskuleere Speerre” collaborative artwork by artists group “Entente Sublimale”
More or less recently I had seen a video in which a famous politician was talking in a way which gave me the impression that this person was on drugs. I may have been wrong, but still. It should be said that in the video the person had to comment on a very tragic event and that was sofar the only time where I saw this politician in this state.
Then there was also Jeroen Dijsselbloems recent controversial remarks about economic failures due to alcohol and women and the following discussions, where it was e.g. remarked that after taking interest payments away, the economics of the Netherlands seems to look actually worse than that of Southern Europe. All this made me look a bit at examples of drugs and in particular opiods in connection with economics and politics.
(more…)